
Global Renewable Energy Statistics 2026: Wind, Solar, and Hydropower Data
The year 2026 is recorded as the year when the "Great Transition" became more than just a slogan, transforming into the main reality of physical grids in energy history. The intense investments and technological leaps following global energy crises have positioned renewable sources as the "primary option" rather than an "alternative."
This comprehensive report details global capacity and country-based changes in the realm of renewable energy statistics world, ranging from solar to wind, hydropower to geothermal.
1. 2026 Global Renewable Energy Outlook: General Summary
As of the beginning of 2026, the total installed renewable energy capacity worldwide has exceeded 5,100 GW (Gigawatts). This means we are approaching nearly double the capacity from 2020.
Key Indicators (2026 Estimated Data)
Energy Type | Installed Capacity (GW) | 2025-2026 Growth (%) | Total Share (%) |
Solar (PV & CSP) | 2,250 | 22% | 44% |
Wind (Onshore & Offshore) | 1,450 | 14% | 28% |
Hydropower | 1,280 | 2% | 25% |
Biomass & Waste | 185 | 5% | 2.5% |
Geothermal & Others | 35 | 8% | 0.5% |
The most significant change in 2026 is that solar energy not only surpasses hydropower in total installed capacity but also takes the difference to a massive scale.
2. Solar Energy: In Pursuit of Leadership
Solar energy continues to take the largest slice of the renewable energy pie in 2026. The acceptance of module efficiencies in the 25% range as standard and the full integration of "Perovskite" based cells into the commercial market have driven costs down to around $0.10 per watt.
Regional Solar Energy Leaders
China: Holds 45% of the total capacity alone.
European Union: Increased its capacity, especially with the explosion of balcony-type solar plants (Plug-in Solar) in Germany and Spain.
USA: The Inflation Reduction Act (IRA) continues to bear fruit; state-based incentives have set records in residential installations.
Note: In 2026, floating solar panels became mainstream in countries with land constraints (Japan, South Korea, Netherlands).
3. Wind Energy: Offshore Revolution
Wind energy is hosting massive turbines in 2026 thanks to "economies of scale." We are now in an era where a single turbine can reach 18-22 MW capacity.
Onshore vs. Offshore Wind
Onshore: The vast plains of China and the USA remain dominant. However, the growth rate has slowed due to environmental objections.
Offshore: In 2026, offshore investments reached 35% of total wind investments. The North Sea is on its way to becoming the world's "energy hub."
Country-Based Distribution
Denmark: Obtains more than 70% of its electricity consumption from wind.
United Kingdom: Increased its capacity above 50 GW by hosting the world's largest offshore wind farms.
Brazil: As the wind leader in South America, increased its capacity by 15% annually.
4. Hydropower: The Steady Giant
Hydropower continues to be the world's oldest and largest baseload renewable energy source. However, data from 2026 shows that the construction of new dams has slowed due to environmental factors and a lack of suitable locations.
Modernization: Upgrading existing plants with efficiency-enhancing turbine replacements (repowering) is the main trend of 2026.
Pumped Storage Hydropower (PSH): The demand for PSH projects is growing faster than traditional dams due to the need for energy storage.
5. Biomass and Geothermal: Niche but Critical
To balance the variable nature of solar and wind, biomass and geothermal energy serve as a "safety net" in the 2026 grids.
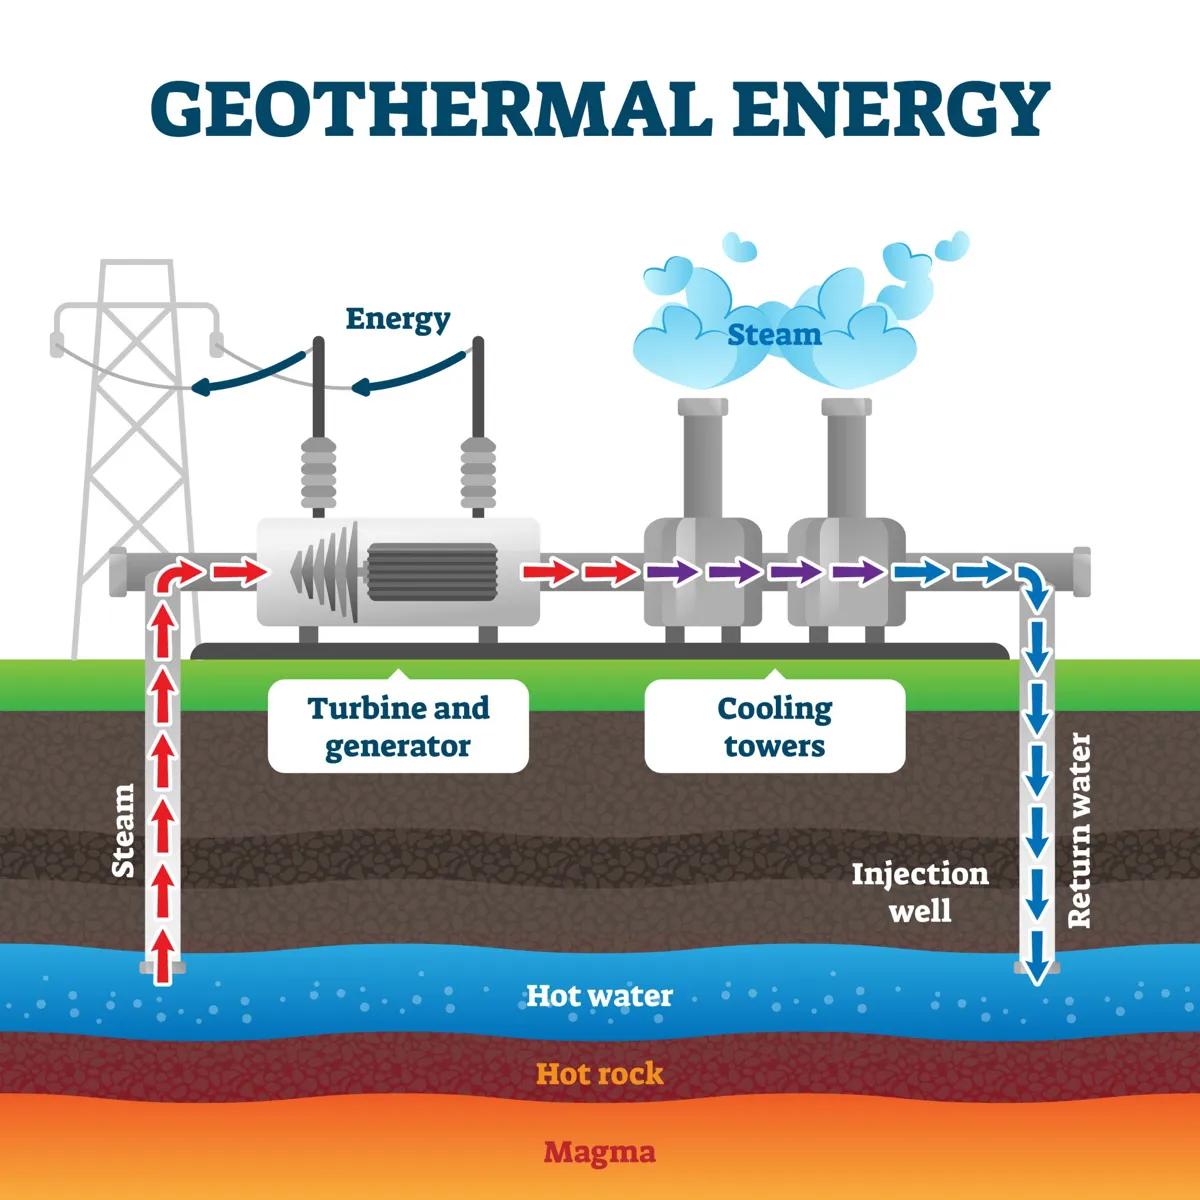
Geothermal Energy Trends
Particularly, Iceland, Kenya, and Turkey rank high in geothermal capacity, while the USA and Indonesia have achieved commercial success in extracting energy from rock depths thanks to "Enhanced Geothermal Systems" (EGS).
Biomass Energy
The production of sustainable aviation fuel (SAF) has shifted the focus of biomass facilities from just electricity to liquid fuel production.
6. Energy Storage and Smart Grids in 2026
It is not enough to just produce; 2026 is the year when Lithium-Iron-Phosphate (LFP) and Sodium-Ion batteries have scaled up to grid level.
Total Storage Capacity: A global storage capacity of 650 GWh (Gigawatt-hours) has been reached.
Green Hydrogen: Excess energy obtained from wind and solar has begun to be used as hydrogen in industries (steel, cement) as of 2026.
7. Country-Based Renewable Energy Report Card 2026
The table below shows the countries with the highest "Renewable Energy Share" (in electricity generation) at the beginning of 2026:
Country | Renewable Share (%) | Main Source |
Norway | 99% | Hydropower |
Iceland | 100% | Geothermal & Hydro |
Uruguay | 98% | Wind & Hydro |
Denmark | 82% | Wind |
China | 38% | Mixed (Solar-led) |
Germany | 62% | Wind & Solar |
8. Data Analysis for Researchers: Why Now?
For journalists and policymakers, this data indicates: The energy transition is no longer an "environmental choice" but an economic necessity. In 2026, generating electricity from solar energy is on average 40% cheaper than from coal.
Data Set Summary:
Total Number of Installations: There are an estimated 180 million active solar installations and 1.2 million wind turbines worldwide (including micro installations).
Annual Growth Trend: The renewable energy sector has shown a compound annual growth rate (CAGR) of 12.5% from 2020 to 2026.
Conclusion: Towards 2030 Goals
The 2026 statistics prove that the world still has much to do to reach the "Net Zero" target, but the momentum has reached an irreversible point. The dominance of solar and wind in the grid has become the strongest asset for countries seeking energy independence.
This data serves as a strategic compass for decision-makers in the sector. If you also want to build a sustainable future, you should turn your investment direction towards this bright horizon indicated by the data.
Related Articles
World's Largest Ten Energy Plants: Capacity for Installation by 2026
Hydroelectric Energy: How Do Dams Generate Electricity?
What is a Combined Cycle Power Plant? CCGT Technology and Operating Principle
Countries with the Most Power Plants: Global Energy Infrastructure Ranking (2026)